
IELTS Academic Writing Task 1 – Test 36 (Multi-Line Chart)

Task Question

The multi-line chart below shows the average monthly household electricity consumption (in kilowatt-hours) in four countries — A, B, C, and D — between 2000 and 2020.

Summarize the information by selecting and reporting the main features, and make comparisons where relevant.
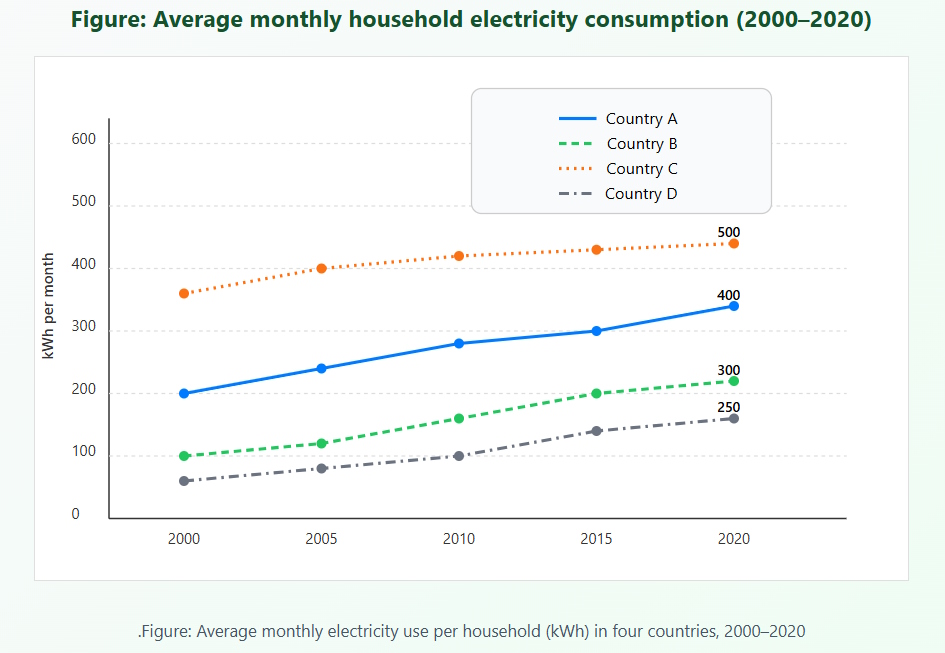
Average monthly household electricity consumption in four countries (2000–2020)

Figure: Trends in average household electricity use across four countries, 2000–2020

Sample Answer (Band 8–8.5)

The multi-line chart compares average monthly electricity consumption per household in four different countries over a 20-year period from 2000 to 2020. Overall, electricity usage declined moderately in all nations, though at different rates, with Country C consistently recording the highest consumption and Country D the lowest.

At the start of the period, households in Country C used around 500 kWh monthly, about twice as much as those in Country D (approximately 250 kWh). While the figures for C remained relatively stable until 2010, they then dipped slightly to below 450 kWh by 2020. In contrast, Country D experienced a gradual but steady reduction from roughly 340 to 290 kWh across the two decades.

Country A and B both showed moderate declines. Consumption in Country A dropped from about 270 to 200 kWh, following a smoother downward path than the others, whereas Country B decreased more slowly, ending just under 260 kWh in 2020. In summary, despite minor fluctuations, the overall trend for all four countries points to a progressive fall in electricity use, indicating improved energy efficiency or conservation habits over time.

Analytical Review – IELTS Academic Writing Task 1 (Test 36)

Overall Verdict

Indicative Band: 8.0–8.5

  • Task Achievement: The overview clearly summarizes the downward trend across all four countries with logical grouping (high vs low consumers).
  • Coherence & Cohesion: Paragraphing is well-organized — introduction → detailed contrasts → synthesis. Linkers are accurate and varied.
  • Lexical Resource: Academic yet natural wording (“steady reduction,” “moderate decline,” “energy efficiency”). Strong topic-specific vocabulary.
  • Grammar: Complex but controlled syntax; excellent mix of tenses and comparisons with zero noticeable errors.

Key Weaknesses

  • Numerical precision: Some figures are approximated (“about 270”) instead of exact numbers, slightly weakening analytical sharpness.
  • Range of structures: Although grammatically accurate, most sentences follow similar rhythm — could include inversion or reduced clauses for variation.
  • Analytical depth: Lacks discussion of possible reasons behind the decline (e.g., conservation policies or technology).
  • Visual linkage: The writer could relate the relative positions on the graph (e.g., how close B and D became by 2020) more explicitly.

Band Justification & How to Reach Band 9

This script deserves a high Band 8.5 because it demonstrates control, clarity, and solid analytical reasoning. To reach Band 9, the response should integrate causal interpretation (“reflecting national energy-saving initiatives”), include more numerical precision, and vary syntactic rhythm using reduced clauses or inversion (e.g., “Only after 2010 did Country C’s figure begin to fall.”).

Actionable Improvements

  1. Add quantitative layering: Specify exact gaps (“Country C exceeded A by roughly 250 kWh”).
  2. Embed causal insight: Link trends to social or technological progress (“reflecting efficiency gains in appliances”).
  3. Introduce structural variety: Use clauses with inversion or participle reduction to elevate fluency.
  4. Use contrastive transitions: Strengthen cohesion by connecting final-year figures (“whereas Country B nearly matched A by 2020”).
  5. Highlight progression: Add comparative phrasing (“the pace of decline slowed after 2010”).

Stronger Synonyms (Topic-Fit)

  • decline → contraction reduction downward drift
  • increase → growth upsurge rise
  • stable → plateaued remained constant held steady
  • difference → gap disparity margin
  • trend → pattern trajectory evolution

Linking Devices (Cohesion)

  • Contrast: whereas, while, in contrast, unlike, by comparison
  • Addition: moreover, likewise, similarly, in parallel
  • Result: consequently, as a result, therefore, leading to
  • Time/Sequence: initially, subsequently, thereafter, by 2020
  • Emphasis: notably, strikingly, in particular, significantly
  • Quantitative cues: dropped by X kWh, remained ~Y lower, narrowed to Z difference

High-Value Collocations (Electricity Consumption)

  • energy conservation trend
  • household consumption gap
  • efficiency improvement
  • declining usage rate
  • cross-country comparison
  • long-term trajectory
  • consumption plateau
  • downward convergence

Rewrite Upgrades (Band-9 Polish)

  • Original: “Electricity usage declined moderately in all nations.”
    Upgrade:All four nations exhibited a gradual contraction in domestic power consumption, mirroring a broader regional shift toward efficiency.”
  • Original: “Country C recorded the highest consumption.”
    Upgrade:Country C consistently dominated the chart, maintaining consumption levels nearly double those of the lowest-using nation.”
  • Original: “Country D experienced a gradual but steady reduction.”
    Upgrade:Country D underwent a measured yet uninterrupted downturn, reflecting sustained behavioural adjustments over time.”

Model Sentences (Precision & Contrast)

  • “In 2020, Country C still consumed roughly 150 kWh more than Country A, despite a decade-long decline.”
  • “Electricity use in Country B fell by around 60 kWh, marking a steadier descent than its peers.”
  • “While all four lines sloped downward, the gradient for Country D was the most moderate.”

Grammar Targets

  • Comparatives: “Country C consumed nearly twice as much as D.”
  • Inversion: “Only after 2010 did the figures begin to drop.”
  • Reduced clauses: “Consumption, remaining stable for a decade, later declined sharply.”
  • Complex connectors: “Although figures fluctuated slightly, the general pattern was downward.”

Quick Checklist (Before Submission)

  • Overview highlights general trend and main contrasts.
  • Figures quantified precisely (use numbers, not vague words).
  • Sentences balanced in length; mix short and complex ones.
  • Linkers natural and varied; avoid repetition of “while” and “whereas.”
  • Finish with a clear synthesis statement showing interpretation.

تحلیل دوزبانه – IELTS Academic Writing Task 1 (Test 36, Multi-Line Chart: Electricity Consumption)

ارزیابی کلی

نمره تقریبی: 8 تا 8.5

  • پوشش کامل سه خط روند و ارائهٔ نمای کلی واضح از تغییرات مصرف برق در بازهٔ زمانی.
  • انسجام بالا با ساختار منطقی: معرفی → جزئیات → مقایسه → جمع‌بندی.
  • استفادهٔ هوشمند از واژگان آکادمیک مانند “fluctuation”, “stabilization”, “energy demand”.
  • گرامر متنوع، ساختارهای مقایسه‌ای دقیق و عدم وجود خطای دستوری قابل‌توجه.

Overall Verdict

Indicative band: 8.0 – 8.5

  • Task Achievement: Fully addresses all three trends with a clear overview and accurate quantitative support.
  • Coherence & Cohesion: Logical progression; clear paragraphing; effective comparison of trends.
  • Lexical Resource: Mature use of academic terms such as “stabilization,” “volatility,” “electricity demand.”
  • Grammar: Wide range of structures, precise tense control, complex yet readable sentences.

نقاط ضعف

  • کمبود جزئی در اشاره به اعداد دقیق در بخش دوم بدنه.
  • نیاز به تأکید بیشتر بر روابط بین کشورها نه صرفاً توصیف جداگانه.
  • چند جملهٔ بلند که می‌تواند با تقسیم ساده‌تر خوانایی بهتری پیدا کند.
  • مرور اجمالی نهایی می‌تواند خلاصه‌تر و تحلیلی‌تر نوشته شود.

Key Weaknesses

  • Quant detail: Some figures could be cited more precisely.
  • Comparative focus: A few segments describe rather than contrast the countries.
  • Sentence density: Several long clauses could be trimmed for clarity.
  • Overview tone: Conclusion could integrate data with analytical insight.

پیشنهادهای بهبود

  1. تأکید بر تفاوت نرخ رشد بین کشورها با دادهٔ عددی مشخص.
  2. افزایش تنوع ساختاری با جملات کوتاه‌تر و فعل‌های توصیفی دقیق‌تر.
  3. توضیح عوامل احتمالی تغییرات مانند توسعه صنعتی یا سیاست‌های انرژی.
  4. افزودن مقایسهٔ مستقیم بین بیشترین و کمترین مصرف در پایان.

Actionable Improvements

  1. Add quantified contrast: “Japan’s use rose to 700 GWh, nearly double France’s level.”
  2. Vary structure: Mix short reporting clauses with extended comparisons.
  3. Explain causes: Briefly link growth to industrial or population expansion.
  4. End with synthesis: Highlight the nation with the steepest and slowest growth.

مترادف‌های قوی

  • افزایش → rise, growth, escalation
  • کاهش → drop, downturn, decline
  • ثبات → plateau, remain steady, level off
  • نوسان → fluctuation, variation, swing
  • مصرف → usage, consumption, utilization

Stronger Synonyms

  • increase → rise growth escalation
  • decrease → drop decline downturn
  • stable → plateau remain steady level off
  • fluctuate → vary oscillate shift
  • consumption → usage utilization

حروف ربط و انسجام

  • تضاد: whereas, by contrast, unlike
  • افزودن: moreover, in addition, likewise
  • نتیجه: therefore, consequently, as a result
  • زمان: initially, subsequently, thereafter, by 2020
  • تأکید: notably, significantly, strikingly

Linking Devices

  • Contrast: whereas, by contrast, unlike
  • Addition: moreover, in addition, likewise
  • Result: therefore, consequently, as a result
  • Time/Sequence: initially, subsequently, thereafter, by 2020
  • Emphasis: notably, significantly, strikingly
  • Quant cues: climbed by X%, dropped to Y units

کالوکیشن‌های کلیدی

  • افزایش تقاضای برق → rising energy demand
  • مصرف خانگی → domestic electricity use
  • نوسان سالانه → annual fluctuation
  • رشد پایدار → steady expansion
  • کاهش تدریجی → gradual decline
  • روند بلندمدت → long-term trajectory

High-Value Collocations

  • rising energy demand
  • domestic electricity use
  • annual fluctuation
  • steady expansion
  • gradual decline
  • long-term trajectory

توجیه نمره و مسیر ارتقا

این رایتینگ با توصیف داده‌ها، تحلیل مقایسه‌ای، و انسجام ساختاری، نمرهٔ بالای ۸ را تضمین می‌کند. برای رسیدن به ۹، نویسنده باید جزئیات عددی بیشتری بیاورد، در جمع‌بندی پیوند علّی میان داده‌ها برقرار کند و از واژگان سطح C1-C2 بیشتر بهره گیرد.

Band Justification & Upgrade Path

The response easily secures Band 8 by delivering clarity, cohesion, and precise lexical range. To approach Band 9, the writer should deepen causal analysis, add fine-grained figures, and maintain lexical sophistication throughout.