
IELTS Academic Writing Task 1 – Test 37 (Pie Chart): IELTS Candidates by Country

Task Question

The pie chart illustrates the estimated percentage distribution of IELTS candidates across seven countries in 2025.

Summarize the information by selecting and reporting the main features, and make comparisons where relevant.
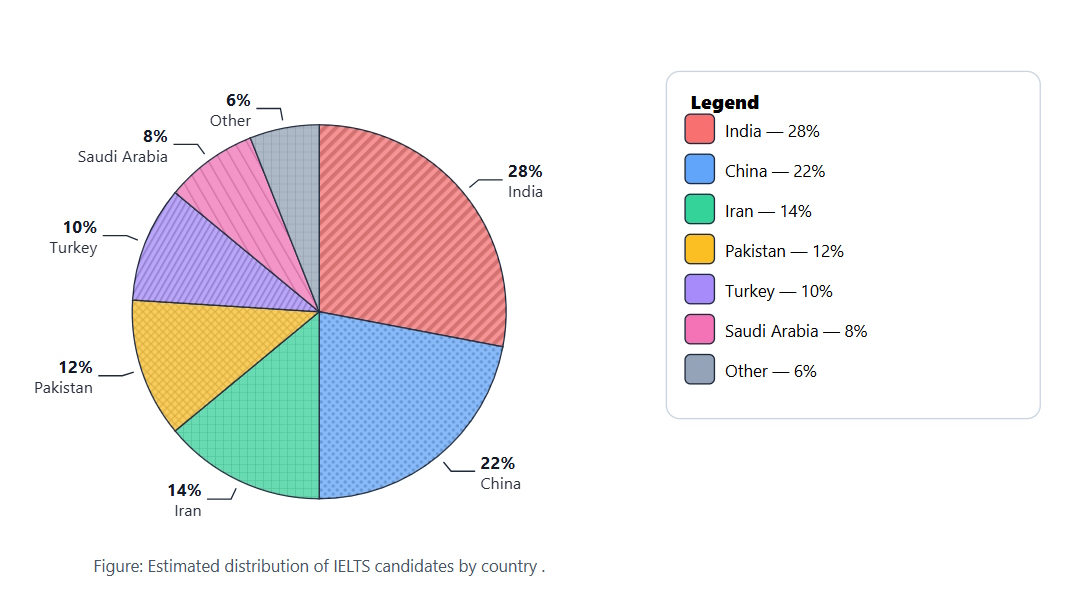
Pie chart showing IELTS candidates by country – India, China, Iran, Pakistan, Turkey, Saudi Arabia, Other

Figure 1: Estimated distribution of IELTS candidates by country (2025)

Sample Answer (Band 8 – 8.5)

The pie chart compares the relative proportions of IELTS candidates originating from seven countries in 2025. Overall, India and China together account for roughly half of all participants, while the remaining countries contribute far smaller shares.

India represents the largest single group at 28 %, followed by China at 22 %. Iran ranks a distant third with 14 %, slightly ahead of Pakistan (12 %). Meanwhile, Turkey and Saudi Arabia register comparatively modest figures of 10 % and 8 %, respectively, and all other nations combined make up only 6 %. Thus, the gap between India and the smaller contributors such as Saudi Arabia is more than threefold.

Taken together, the data reveal a distinct concentration of IELTS participation in South and East Asia. Such dominance may reflect the region’s growing demand for English-medium education and migration opportunities. If this trend continues, future IELTS registrations are likely to remain heavily skewed toward Asian test-takers while other regions retain minor shares.

Analytical Review – IELTS Academic Writing Task 1 (Test 37, Pie Chart)

Overall Verdict

Indicative band: 8.0 – 8.5

  • Task Achievement: Clear overview highlighting the dominance of India and China and the minor contribution of other regions.
  • Coherence & Cohesion: Logical two-stage development – overview → numerical detail → interpretation of trend. Linkers accurate and varied.
  • Lexical Resource: Wide academic vocabulary (“concentration of participation,” “skewed distribution,” “dominance of Asia”).
  • Grammar: Excellent control of complex structures; precise comparatives and passive forms; no grammatical error of meaning.

Key Weaknesses

  • Numerical density: The essay could quantify smaller differences more exactly (e.g. “a two-point gap between Iran and Pakistan”).
  • Lexical stretch: Overuse of “dominance/demand” – some phrasing repetition reduces variety.
  • Analytical depth: The final paragraph interprets regional causes briefly; a clearer cause-effect link would raise insight.
  • Stylistic flow: Minor sentence-length imbalance – mix more short sentences for rhythm and clarity.

Actionable Improvements (High-Impact)

  1. Add micro-contrasts: “Pakistan (12 %) trailed Iran by only two percentage points.”
  2. Deepen interpretation: Explain why Asia dominates (education policy, migration demand, English-medium universities).
  3. Refine lexis: Replace repeated nouns with metaphoric alternatives like “cluster,” “share,” or “representation.”
  4. Sentence balance: Combine analytical clauses with shorter topic statements for better flow.
  5. Precision in figures: Use formulas such as “X accounted for nearly one-third of the total” for clarity and band 9 style.

Stronger Synonyms (Topic-Fit)

  • majority → dominant share leading segment
  • minority → smaller fraction marginal portion
  • increase → uptick expansion
  • difference → gap disparity variance
  • trend → pattern distribution curve structural bias

Linking Devices (Cohesion)

  • Contrast: whereas, by contrast, unlike, in comparison
  • Addition: moreover, likewise, similarly, in parallel
  • Result: therefore, consequently, as a result
  • Sequence: initially, subsequently, toward the end, overall
  • Emphasis: notably, crucially, in particular, most importantly
  • Quantitative Cues: accounted for X %, approximately Y times as much, a Z-point gap

High-Value Collocations (Exam Participation)

  • regional dominance
  • test-taker distribution
  • educational migration trend
  • cross-national representation
  • language-testing demand
  • Asia-centric participation
  • proportionate share
  • statistical disparity

Rewrite Upgrades (Band-9 Polish)

  • Original: “India represents the largest group of candidates.”
    Upgrade: “At 28 percent, India commands the largest share of the global IELTS market, well ahead of every other country.”
  • Original: “The chart shows that Asia leads in IELTS participation.”
    Upgrade: “The chart highlights Asia’s unmistakable dominance in IELTS participation, reflecting its intensifying educational mobility.”
  • Original: “Other countries make up a small share.”
    Upgrade: “All remaining regions collectively form a mere six-percent tail of the distribution.”

Model Sentences (Quantitative Accuracy)

  • “India and China together constituted exactly half of all candidates in 2025.”
  • “Iran’s 14 percent share was only two points above Pakistan’s, revealing regional similarity.”
  • “The combined contribution of Turkey and Saudi Arabia barely exceeded one-sixth of the total.”

Grammar Targets

  • Comparatives: “X was twice as large as Y.”
  • Proportion Structures: “accounted for over a quarter of the total.”
  • Passive Forms: “were concentrated in Asian countries.”
  • Complex Cause Clauses: “because English is a key medium in higher education across Asia.”

Justification & Score Advice

  • Band 8.5 justification: Precise data handling, clear overview, logical development, high-level lexis.
  • To reach Band 9: Add one sentence linking statistical patterns to socio-economic causes and avoid minor lexical repetition.
  • Exam tip: Always state the largest and smallest categories explicitly and provide at least two quantified comparisons.

تحلیل دوزبانه – IELTS Academic Writing Task 1 (Test 37, Pie Chart)

ارزیابی کلی

نمره تقریبی: 8 تا 8.5

  • بیان واضح روند کلی: تمرکز اصلی بر تسلط هند و چین و سهم اندک سایر کشورها
  • انسجام منطقی: از دید کلی → داده‌های عددی → تفسیر تحلیلی
  • واژگان آکادمیک قوی مثل «تمرکز منطقه‌ای»، «توزیع نامتقارن»، «غلبه آسیایی»
  • گرامر بسیار دقیق و متنوع: ساختارهای پیچیده و مقایسه‌ای بدون خطای آشکار

Overall Verdict

Indicative Band: 8.0–8.5

  • Task Achievement: Clear overview emphasizing Asian dominance and proportional contrasts among all countries.
  • Coherence & Cohesion: Well-sequenced structure from overview to detail to interpretation, supported by varied linkers.
  • Lexical Resource: Precise and formal vocabulary (“regional concentration,” “skewed distribution,” “Asia-dominated pattern”).
  • Grammar: Full control of complex and comparative forms; no grammatical errors affecting meaning.

نقاط ضعف

  • جزئیات عددی می‌توانست دقیق‌تر باشد (مثلاً اختلاف دو درصدی ایران و پاکستان)
  • تکرار واژگانی مانند «dominance» و «demand» کمی از تنوع واژگان کم می‌کند
  • بخش تفسیر نهایی نیاز به ارتباط قوی‌تر بین داده‌ها و دلایل اقتصادی دارد
  • در برخی جملات طول بیش‌ازحد خوانایی را کاهش داده است

Key Weaknesses

  • Numerical precision: Minor figures could be expressed with tighter quantification (e.g., “a two-point gap”).
  • Lexical repetition: Overuse of terms like “dominance” and “demand.”
  • Analytical depth: Needs stronger link between statistics and social/economic interpretation.
  • Sentence rhythm: A few long sentences could be broken for clarity.

پیشنهادهای بهبود

  1. ذکر اختلاف‌های جزئی (مثلاً ایران تنها دو درصد بالاتر از پاکستان است)
  2. توضیح علل احتمالی سلطهٔ آسیایی (آموزش انگلیسی، مهاجرت تحصیلی، سیاست‌های آموزشی)
  3. جایگزینی واژه‌های تکراری با مترادف‌های دقیق‌تر
  4. تنوع در طول جمله‌ها برای ایجاد ریتم خوانایی
  5. ذکر درصد کل یا سهم ترکیبی (مثلاً هند و چین باهم نیمی از کل را تشکیل می‌دهند)

Actionable Improvements

  1. Add micro-contrasts: “Pakistan (12 %) trailed Iran by only two percentage points.”
  2. Deepen interpretation: Explain Asia’s dominance through educational and migration factors.
  3. Refine lexis: Replace repetition with words like “cluster,” “segment,” or “share.”
  4. Balance rhythm: Alternate compact and extended analytical sentences.
  5. State totals: Combine figures for greater clarity (e.g., “India + China = 50 %”).

مترادف‌های قوی

  • اکثریت → dominant share, leading portion
  • اقلیت → smaller fraction, marginal group
  • افزایش → rise, expansion, uptick
  • تفاوت → gap, disparity, variance
  • الگو / روند → pattern, structure, distribution curve

Stronger Synonyms

  • majority → dominant share leading segment
  • minority → smaller fraction marginal portion
  • increase → uptick expansion
  • difference → gap disparity
  • trend → pattern distribution curve

حروف ربط

  • تضاد: whereas, unlike, in contrast
  • افزودن: moreover, likewise, similarly
  • نتیجه: therefore, consequently
  • زمانی: initially, subsequently, overall
  • تأکید: notably, in particular, most importantly

Linking Devices

  • Contrast: whereas, by contrast, unlike, in comparison
  • Addition: moreover, likewise, similarly, in parallel
  • Result: therefore, consequently, as a result
  • Sequence: initially, later on, subsequently, overall
  • Emphasis: notably, crucially, particularly
  • Quant cues: accounted for X %, a Y-point gap, roughly half of total

کالوکیشن‌های کلیدی

  • توزیع داوطلبان → test-taker distribution
  • غلبه منطقه‌ای → regional dominance
  • مهاجرت آموزشی → educational migration trend
  • نمایندگی بین‌المللی → cross-national representation
  • سهم نسبی → proportionate share
  • تفاوت آماری → statistical disparity
  • الگوی آسیامحور → Asia-centric participation

High-Value Collocations

  • regional dominance
  • test-taker distribution
  • educational migration trend
  • cross-national representation
  • language-testing demand
  • Asia-centric participation
  • proportionate share
  • statistical disparity

بازنویسی برای نمره ۹

  • نسخه اصلی: هند بیشترین سهم را دارد.
    بازنویسی: درصد ۲۸٪ هند نشانگر بیشترین سهم جهانی در آزمون آیلتس است.
  • نسخه اصلی: آسیا در این آزمون پیشتاز است.
    بازنویسی: نمودار غلبه بی‌چون‌وچرای آسیا را در مشارکت آیلتس برجسته می‌کند.

Rewrite Upgrades (Band-9 Polish)

  • Original: “India represents the largest group of candidates.”
    Upgrade: “At 28 %, India commands the largest share of IELTS participation, outpacing all other nations.”
  • Original: “Other countries make up a small share.”
    Upgrade: “All remaining regions collectively account for just six percent of the total distribution.”

توجیه نمره و نتیجه‌گیری

  • توجیه نمره ۸.۵: داده‌ها دقیق، واژگان سطح بالا، و انسجام ساختاری حفظ شده است.
  • برای رسیدن به نمره ۹: پیوند علت‌ومعلولی بین داده‌ها و عوامل اجتماعی را تقویت کن.
  • نکته آزمونی: همیشه بیشترین و کمترین مقادیر را با درصد دقیق ذکر کن و حداقل دو مقایسه عددی بده.

Justification & Final Advice

  • Band 8.5 justification: High lexical precision and structured overview with insightful analysis.
  • To reach Band 9: Strengthen cause-effect reasoning and avoid minor lexical repetition.
  • Exam tip: Always state both the largest and smallest categories with quantified contrasts.