
IELTS Academic Writing Task 1 – Sample Test33 (Bar + Line)

Task Question

The bar chart illustrates the average commuting distance by car, bus, and train in 2020, while the line chart presents the trend in global fuel prices between 2010 and 2020.

Summarize the information by selecting and reporting the main features, and make comparisons where relevant.
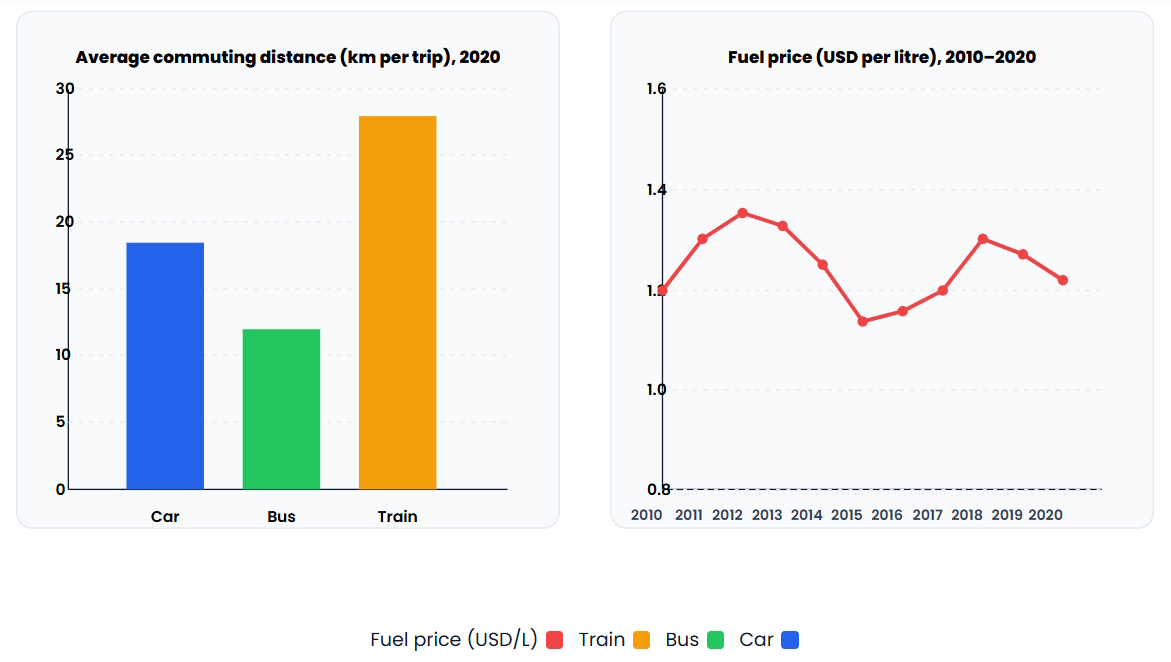
Bar and line chart showing commuting distance by transport type and fuel price trends (2010–2020)

Figure: Average commuting distances (2020) and global fuel price fluctuations (2010–2020)

Sample Answer (Band 8.0–8.5)

The two charts together reveal a clear relationship between travel patterns and fuel costs. In 2020, people who commuted by train covered the longest distances on average, whereas bus passengers travelled the shortest routes. Over the same decade, the price of fuel experienced significant volatility, peaking in the early 2010s before declining steadily towards 2020.

Regarding average distances, the figure for train users stood at roughly 28 kilometres per trip, considerably higher than that for car drivers (about 18.5 km) and bus commuters (around 12 km). This indicates that public transport in the form of trains generally serves longer intercity or suburban journeys, while buses and private cars cater to shorter urban commutes.

Fuel prices, meanwhile, showed a pronounced rise from approximately $1.20 per litre in 2010 to nearly $1.45 in 2012, followed by a steady fall reaching a trough of about $1.05 in 2015. Although prices recovered slightly afterwards, they never returned to earlier highs, ending the decade near $1.15. This overall downward movement coincided with growing transport efficiency and a gradual shift towards mass transit options for longer trips.

In summary, the charts suggest an inverse relationship between fuel costs and commuting distance, with trains dominating longer journeys and fuel becoming increasingly affordable towards the end of the period.

Analytical Review – IELTS Academic Writing Task 1 (Test 33)

Overall Verdict

Indicative Band: 8.0–8.5

  • Task Achievement: Fully addresses both charts with a logical comparison between commuting modes and fuel price trends.
  • Coherence & Cohesion: Smooth structure: overview → distances → price trend → synthesis. Linkers are precise and natural.
  • Lexical Resource: Strong topic-specific vocabulary (“volatility,” “intercity,” “inverse relationship,” “affordability”).
  • Grammar: Complex yet controlled structures with excellent tense consistency and accurate comparative forms.

Key Weaknesses

  • Numerical specificity: Could include more exact values for key peaks and troughs in fuel prices.
  • Analytical linkage: The correlation between cheaper fuel and longer commutes could be explained in more depth.
  • Lexical repetition: Terms like “fuel” and “distance” appear frequently—synonyms could enhance variety.
  • Interpretive depth: The final paragraph could mention broader implications (urban planning, sustainability).

Actionable Improvements (High-Impact)

  1. Add precise quantifiers: e.g., “fuel prices fell by around 30% between 2012 and 2015.”
  2. Enhance causal linking: Explain how rising or falling fuel costs influence commuting behavior.
  3. Vary lexis: Use synonyms such as “energy costs,” “petrol expenses,” or “travel radius.”
  4. Broaden insight: Conclude with one sentence on sustainability or transport policy implications.
  5. Refine transitions: Replace basic connectors (“while,” “also”) with analytical linkers (“inversely,” “correspondingly”).

Stronger Synonyms (Transport & Energy)

  • distance → travel span journey length commuting range
  • fuel → energy cost petrol expense fuel rate
  • increase → spike upsurge climb
  • decrease → drop dip decline
  • trend → trajectory pattern evolution

Linking Devices (Cohesion)

  • Contrast: whereas, while, in contrast, on the other hand
  • Causality: consequently, therefore, as a result, inversely
  • Addition: moreover, in parallel, similarly
  • Time/Sequence: initially, over the following years, by the end of the decade
  • Emphasis: notably, particularly, most strikingly
  • Summary: overall, in summary, to conclude

High-Value Collocations (Commuting & Fuel)

  • fuel price volatility
  • energy cost decline
  • commuting behavior pattern
  • journey-length disparity
  • transport efficiency gains
  • mass-transit adoption
  • urban mobility shift
  • fuel-affordability trend

Band Justification & Path to Band 9

The essay demonstrates strong analytical control and precise structure, deserving a high Band 8.0–8.5 score. To achieve Band 9, the writer should integrate explicit numerical references for key fluctuations, expand causal reasoning between the two datasets, and display deeper topic insight—linking fuel dynamics to economic or environmental implications. A final evaluative statement highlighting policy relevance (e.g., “improving energy efficiency reduces commuting cost”) would deliver the sophistication typical of top-band answers.

Model Sentence Upgrades (Band-9 polish)

  • Original: “Fuel prices showed a pronounced rise followed by a steady fall.”
    Upgrade: “Fuel costs spiked sharply in the early 2010s before undergoing a sustained correction towards the decade’s close.”
  • Original: “Train users covered the longest distances.”
    Upgrade:Rail commuters maintained the broadest travel radius, reflecting their reliance on longer intercity routes.”
  • Original: “This indicates that trains serve longer journeys.”
    Upgrade: “This pattern underscores the structural role of rail systems in linking suburban and metropolitan zones.”

Grammar Targets

  • Comparatives: “Train distances were more than twice those of buses.”
  • Passives: “Fuel prices were influenced by global demand shifts.”
  • Nominalization: “The volatility of energy costs shaped commuting trends.”
  • Adverbial cohesion: “Initially high, prices subsequently stabilized.”

Quick Checklist (Before Submit)

  • Clear overview of both charts.
  • Explicit contrasts and numeric references.
  • Lexical variety and topic-specific collocations.
  • Logical link between commuting and fuel trends.
  • Polished conclusion with interpretive insight.

تحلیل دوزبانه – Test 33, Bar + Line: Commuting Distance & Fuel Prices

ارزیابی کلی

نمره تقریبی: 8.0 تا 8.5

  • پوشش کامل هر دو نمودار (میله‌ای و خطی) با تحلیل منطقی ارتباط میان قیمت سوخت و الگوهای رفت‌وآمد
  • ساختار روان و حرفه‌ای: مرور کلی → فاصله‌های تردد → روند قیمت سوخت → جمع‌بندی
  • واژگان تخصصی دقیق مانند «volatility»، «inverse relationship»، «affordability»
  • جملات پیچیده و کنترل‌شده با دقت بالا در زمان‌ها و ساخت‌های مقایسه‌ای

Overall Verdict

Indicative Band: 8.0–8.5

  • Task Achievement: Fully covers both charts, linking commuting distance to fuel price evolution.
  • Coherence & Cohesion: Smooth structure—overview → distances → fuel trend → synthesis.
  • Lexical Resource: Topic-specific lexis: “volatility,” “intercity,” “affordability,” “inverse relationship.”
  • Grammar: Controlled complex sentences and accurate comparative phrasing throughout.

نقاط ضعف

  • ذکر عدد دقیق برای اوج و کف قیمت سوخت می‌تواند دقت تحلیلی را افزایش دهد
  • رابطه بین کاهش قیمت سوخت و افزایش سفرها باید بیشتر توضیح داده شود
  • تکرار کلمات «fuel» و «distance» باعث کاهش تنوع واژگانی شده است
  • در جمع‌بندی، اشاره‌ای کوتاه به پیامدهای زیست‌محیطی می‌تواند تحلیل را عمیق‌تر کند

Key Weaknesses

  • Numerical specificity: Missing precise values for peaks and troughs.
  • Causal linkage: The connection between cheaper fuel and longer commutes is underdeveloped.
  • Repetition: Overuse of “fuel” and “distance.”
  • Interpretive depth: Environmental or policy insights could enrich the conclusion.

پیشنهادهای بهبود

  1. ذکر داده‌های دقیق‌تر مانند «کاهش ۳۰٪ بین سال‌های ۲۰۱۲ تا ۲۰۱۵»
  2. توضیح ارتباط علّی بین هزینه سوخت و الگوی سفر
  3. استفاده از واژه‌های جایگزین مثل «energy cost»، «petrol expense»، «travel radius»
  4. افزودن جمله‌ای درباره پایداری یا سیاست‌های حمل‌ونقل در پایان
  5. جایگزینی اتصال‌دهنده‌های ساده با موارد تحلیلی‌تر (مثل «correspondingly»، «inversely»)

Actionable Improvements

  1. Add precise quantifiers: “Fuel prices fell by around 30% between 2012 and 2015.”
  2. Strengthen causality: Explain how energy costs shape commuting behavior.
  3. Vary vocabulary: Use “petrol expenses,” “energy rates,” or “travel radius.”
  4. Include broader insight: Mention sustainability or transport policy in the conclusion.
  5. Upgrade linkers: Replace basic ones with “inversely,” “correspondingly,” or “in turn.”

مترادف‌های قوی (حمل‌ونقل و انرژی)

  • distance → travel span, journey length, commuting range
  • fuel → energy cost, petrol expense, fuel rate
  • increase → spike, upsurge, climb
  • decrease → drop, dip, decline
  • trend → trajectory, pattern, evolution

Stronger Synonyms (Transport & Energy)

  • distance → travel span journey length commuting range
  • fuel → energy cost petrol expense fuel rate
  • increase → spike upsurge climb
  • decrease → drop dip decline
  • trend → trajectory pattern evolution

حروف ربط و انسجام

  • تضاد: whereas, in contrast, while
  • علّی: consequently, therefore, inversely
  • افزودن: moreover, similarly, in parallel
  • زمانی: initially, by the end of the decade
  • تأکید: notably, particularly, most strikingly

Linking Devices (Cohesion)

  • Contrast: whereas, in contrast, while
  • Causality: consequently, therefore, inversely
  • Addition: moreover, similarly, in parallel
  • Sequence: initially, over the following years, by 2020
  • Emphasis: notably, particularly, strikingly
  • Summary: overall, in summary, to conclude

کالوکیشن‌های کلیدی (رفت‌وآمد و سوخت)

  • نوسان قیمت سوخت → fuel price volatility
  • الگوی رفت‌وآمد → commuting behavior pattern
  • صرفه‌جویی انرژی → energy efficiency gains
  • تغییر الگوی حمل‌ونقل → urban mobility shift
  • روند کاهش هزینه سوخت → fuel affordability trend

High-Value Collocations

  • fuel price volatility
  • energy cost decline
  • commuting behavior pattern
  • transport efficiency gains
  • urban mobility shift
  • fuel affordability trend

توجیه نمره و مسیر تا Band 9

ساختار منظم و واژگان تخصصی پاسخ را در سطح 8 تا 8.5 قرار می‌دهد. برای رسیدن به 9 باید ۱) اعداد دقیق‌تر (اوج و کف) ذکر شوند، ۲) رابطه علّی بین قیمت سوخت و الگوی سفر تحلیل شود، ۳) واژگان متنوع‌تر برای اجتناب از تکرار به‌کار رود، و ۴) در جمع‌بندی، ارتباط اقتصادی یا زیست‌محیطی برجسته گردد.

Band Justification & Path to Band 9

The response demonstrates analytical precision and clear structure (Band 8–8.5). To reach Band 9, integrate specific data references, deepen causal reasoning, and expand lexical range by avoiding repetition. A succinct comment on sustainability or energy policy would add interpretive maturity typical of Band 9 writing.