
IELTS Academic Writing Task 1 – Sample Test11 (Pie + Bar Charts)
Task Question
The pie chart below shows the distribution of energy consumption by sector in a European country in 2010. The bar chart compares CO₂ emissions from these sectors in 2010.
Summarize the information by selecting and reporting the main features, and make comparisons where relevant.
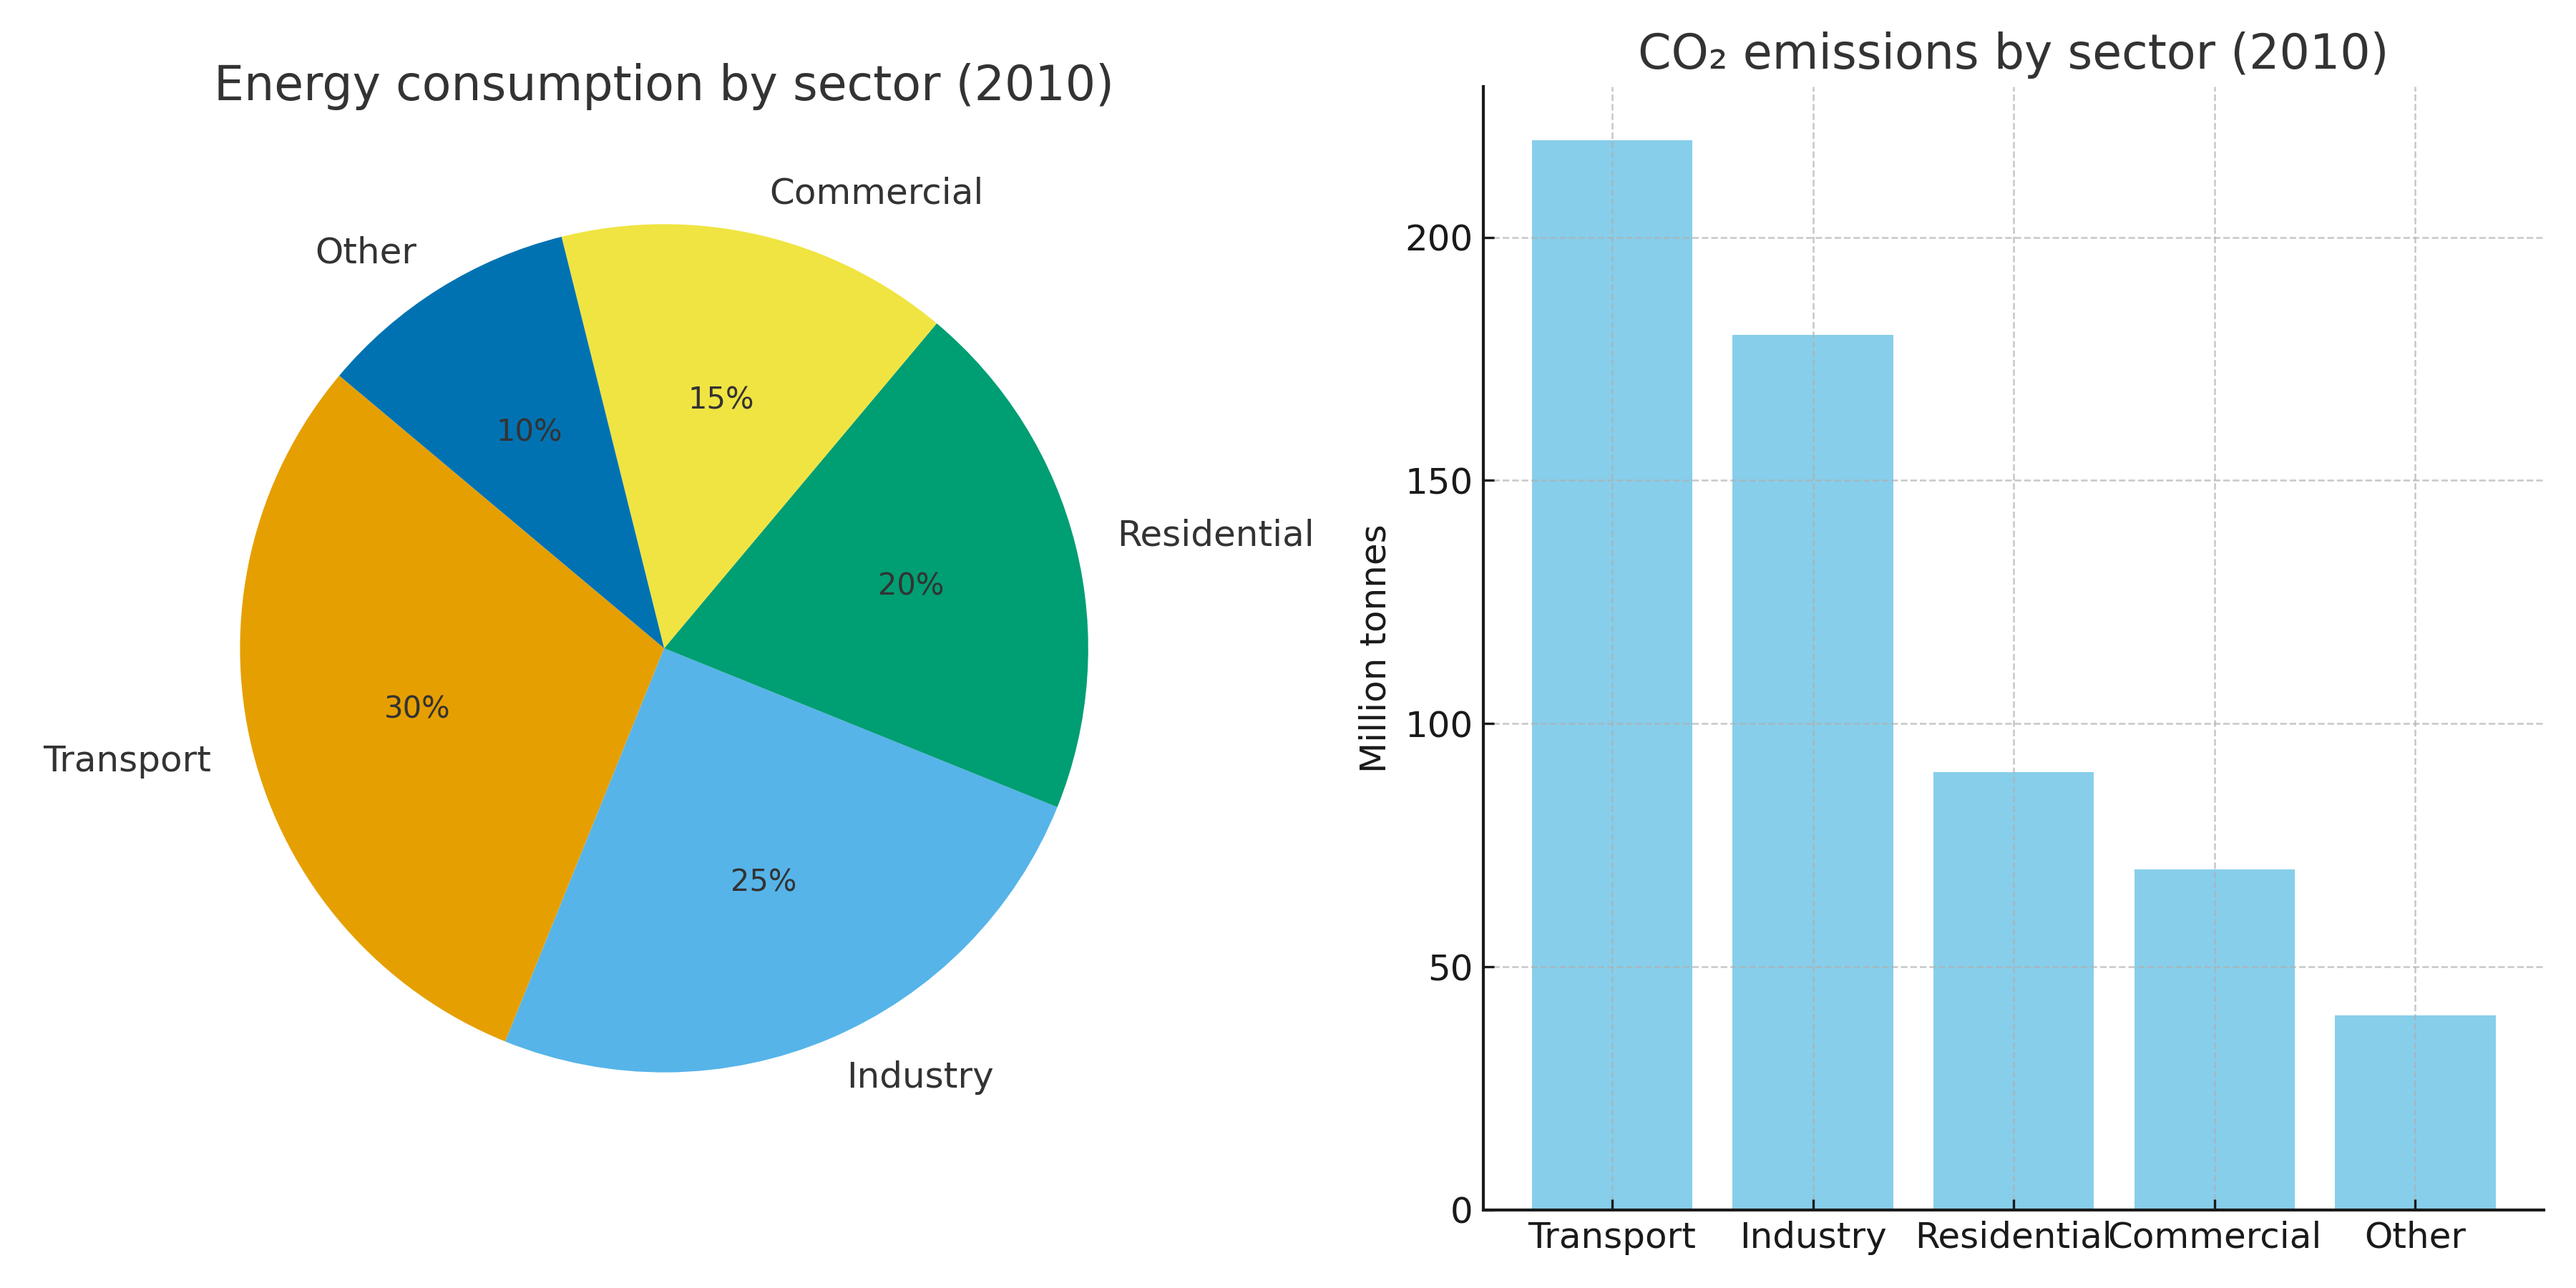
Figure: Energy use by sector and CO₂ emissions (2010)
Sample Answer (Band 7.5–8)
The pie chart illustrates how energy was consumed by different sectors in a European country in 2010, while the bar chart displays the corresponding levels of carbon dioxide emissions from these sectors in the same year.
Overall, although transport and industry were the dominant energy users and emitters, there was a clear mismatch between the share of energy consumed and the emissions produced, particularly in transport.
Transport accounted for the largest proportion of energy use (30%) and generated by far the highest CO₂ emissions, exceeding 200 million tonnes. Industry consumed slightly less energy (25%), yet its emissions were also substantial at around 180 million tonnes. Residential and commercial sectors showed lower energy shares (20% and 15%, respectively) but their emissions, though smaller, were not negligible at 90 and 70 million tonnes. The “other” category represented the smallest share of both energy use (10%) and emissions (40 million tonnes).
In summary, transport not only consumed the most energy but also emitted disproportionately high levels of CO₂, whereas residential and commercial sectors had more balanced shares of energy use and emissions.
Analytical Review – IELTS Academic Writing Task 1 (Test 11)
Overall Verdict
Indicative band: 7.5–8.0
- Task Achievement: Clear overview of both charts, highlighting the mismatch between energy use and CO₂ emissions.
- Coherence & Cohesion: Well-structured with logical flow from pie to bar chart; appropriate use of cohesive devices.
- Lexical Resource: Good range of topic-specific lexis (e.g., “distribution,” “proportion,” “substantial,” “disproportionate”).
- Grammar: Accurate complex structures and passive forms; occasional heavy phrasing but generally precise.
Key Weaknesses
- Numerical detail: Some sentences report data vaguely (“not negligible”) instead of precise figures.
- Comparisons: More explicit contrasts could be made (e.g., “transport emissions were over twice residential levels”).
- Repetition: Frequent reuse of “sector” and “emissions”; synonyms needed.
- Sentence density: A few overly long sentences could be broken into shorter, sharper statements.
Actionable Improvements (High-Impact)
- Add sharper contrasts: Example: “Transport produced 220 Mt CO₂, more than double the residential sector (90 Mt).”
- Lexical variation: Replace repeated “sector” with “category,” “domain,” or “field.”
- Concise phrasing: Trim long clauses into two sentences for clarity.
- Quantify proportion-emission gap: Highlight imbalance between energy share and emission share (e.g., transport).
- Highlight extremes clearly: Point out “transport as the clear outlier” for emphasis.
Stronger Synonyms (Topic-Fit)
- sector → category domain field
- increase → climb expand intensify
- large → substantial considerable pronounced
- small → minor marginal negligible
- difference → disparity imbalance gap
Linking Devices (Cohesion)
- Contrast: whereas, in contrast, by comparison
- Addition: moreover, in addition, likewise
- Result: consequently, as a result, therefore
- Time/Sequence: initially, subsequently, simultaneously
- Emphasis: notably, critically, in particular
- Quantitative cues: more than double, roughly half, proportionally higher
High-Value Collocations (Energy & Emissions)
- disproportionate emissions
- dominant contributor
- energy distribution
- carbon output levels
- emission intensity
- sectoral imbalance
- comparative footprint
- clear outlier
Rewrite Upgrades (Band-8 polish)
-
Original: “Transport accounted for the largest proportion of energy use and generated the highest CO₂ emissions.”
Upgrade: “Transport not only consumed the largest energy share (30%) but also emitted a disproportionate 220 Mt of CO₂, making it the sector’s clear outlier.” -
Original: “Residential and commercial sectors showed lower energy shares but their emissions were not negligible.”
Upgrade: “Although residential (20%) and commercial (15%) consumed less energy, their emissions of 90 and 70 Mt were far from insignificant.” -
Original: “The ‘other’ category represented the smallest share of both.”
Upgrade: “The ‘other’ category was consistently marginal, contributing just 10% of energy use and 40 Mt of emissions.”
Model Sentences (Precise Quantification)
- “Transport emitted over twice as much CO₂ as the residential sector, despite only a 10pp gap in energy share.”
- “Industry’s 25% energy use translated into 180 Mt emissions, proportionally aligned with its consumption.”
- “Commercial consumption of 15% resulted in 70 Mt CO₂, showing a balanced ratio of energy to emissions.”
Grammar Targets
- Comparatives: “X emitted twice as much as Y,” “A used 10pp more energy than B.”
- Passive voice: “emissions were produced by the transport sector.”
- Nominal style: “a clear imbalance was observed between consumption and emissions.”
- Adverbials: “notably higher,” “substantially lower,” “broadly consistent.”
Quick Checklist (Before Submit)
- Overview highlights both charts and key contrasts.
- Figures are reported with precise numbers or pp gaps.
- Lexical variety: synonyms used for “sector,” “emissions,” and “proportion.”
- Sentences are concise, avoiding over-dense phrasing.
- Linkers varied; no repetitive cohesion markers.
تحلیل دوزبانه – IELTS Academic Writing Task 1 (Test 11)
ارزیابی کلی
نمره تقریبی: 7.5 تا 8
- پوشش واضح هر دو نمودار و تأکید بر عدم توازن مصرف انرژی و انتشار کربن
- انسجام و پیوستگی مناسب با جریان منطقی از پایچارت به بارچارت
- واژگان تخصصی مناسب مثل «توزیع»، «تناسب»، «نامتوازن»
- گرامر دقیق با ساختارهای پیچیده و مجهول
Overall Verdict
Indicative band: 7.5–8.0
- Task Achievement: Clear overview of both charts, highlighting mismatch between energy use and CO₂ emissions.
- Coherence & Cohesion: Logical flow from pie to bar; cohesive devices accurate.
- Lexical Resource: Topic lexis (“distribution,” “proportion,” “disproportionate”).
- Grammar: Accurate complex structures, occasional heavy phrasing.
نقاط ضعف
- برخی جملات با اعداد مبهم بیان شدهاند («قابل توجه اما نه زیاد»)
- تکرار زیاد واژههایی مثل «بخش» و «انتشار»
- کمبود مقایسههای صریح بین بخشها
- تراکم زیاد جملات طولانی
Key Weaknesses
- Numerical detail sometimes vague (“not negligible”) instead of precise values.
- Overuse of “sector” and “emissions.”
- Lack of explicit quantified contrasts (e.g., “twice as much as”).
- Dense long sentences reduce clarity.
پیشنهادهای بهبود
- ارائه اختلافهای عددی دقیق (مثلاً دو برابر، نصف، ۱۰ واحد درصد)
- استفاده از مترادف برای جلوگیری از تکرار
- جملههای طولانی را کوتاهتر و روانتر کن
- برجستهسازی بخشهای حدی (مثل ترابری به عنوان استثنا)
Improvements
- Add quantified contrasts: “Transport emitted 220 Mt CO₂, more than double Residential (90 Mt).”
- Lexical variation: replace “sector” with “category” or “domain.”
- Trim clauses into shorter sentences.
- Highlight extremes: call transport the “clear outlier.”
مترادفهای قوی
- بخش → category, domain
- افزایش → climb, expand
- بزرگ → substantial, considerable
- کوچک → minor, marginal
- تفاوت → disparity, gap
Stronger Synonyms
- sector → category, domain
- increase → climb, expand, intensify
- large → substantial, pronounced
- small → marginal, negligible
- difference → disparity, imbalance
حروف ربط
- تضاد: whereas, in contrast
- افزودن: moreover, likewise
- نتیجه: therefore, as a result
Linking Devices
- Contrast: whereas, in contrast
- Addition: moreover, likewise
- Result: consequently, therefore
کالوکیشنهای کلیدی
- انتشار نامتناسب → disproportionate emissions
- بخش غالب → dominant contributor
- شدت انتشار → emission intensity
- مصرف انرژی → energy distribution
High-Value Collocations
- disproportionate emissions
- dominant contributor
- emission intensity
- sectoral imbalance