IELTS Academic Writing Task 1 – Sample Test05 (Horizontal Bar Chart)

Task Question

The horizontal bar chart below shows the percentage of people in five age groups (15–24, 25–34, 35–44, 45–54, and 55+) who engaged in regular physical activity in a country in 2015.

Summarize the information by selecting and reporting the main features, and make comparisons where relevant.

IELTS Academic Writing Task 1 bar chart – physical activity by age group in 2015 (15–24, 25–34, 35–44, 45–54, 55+)

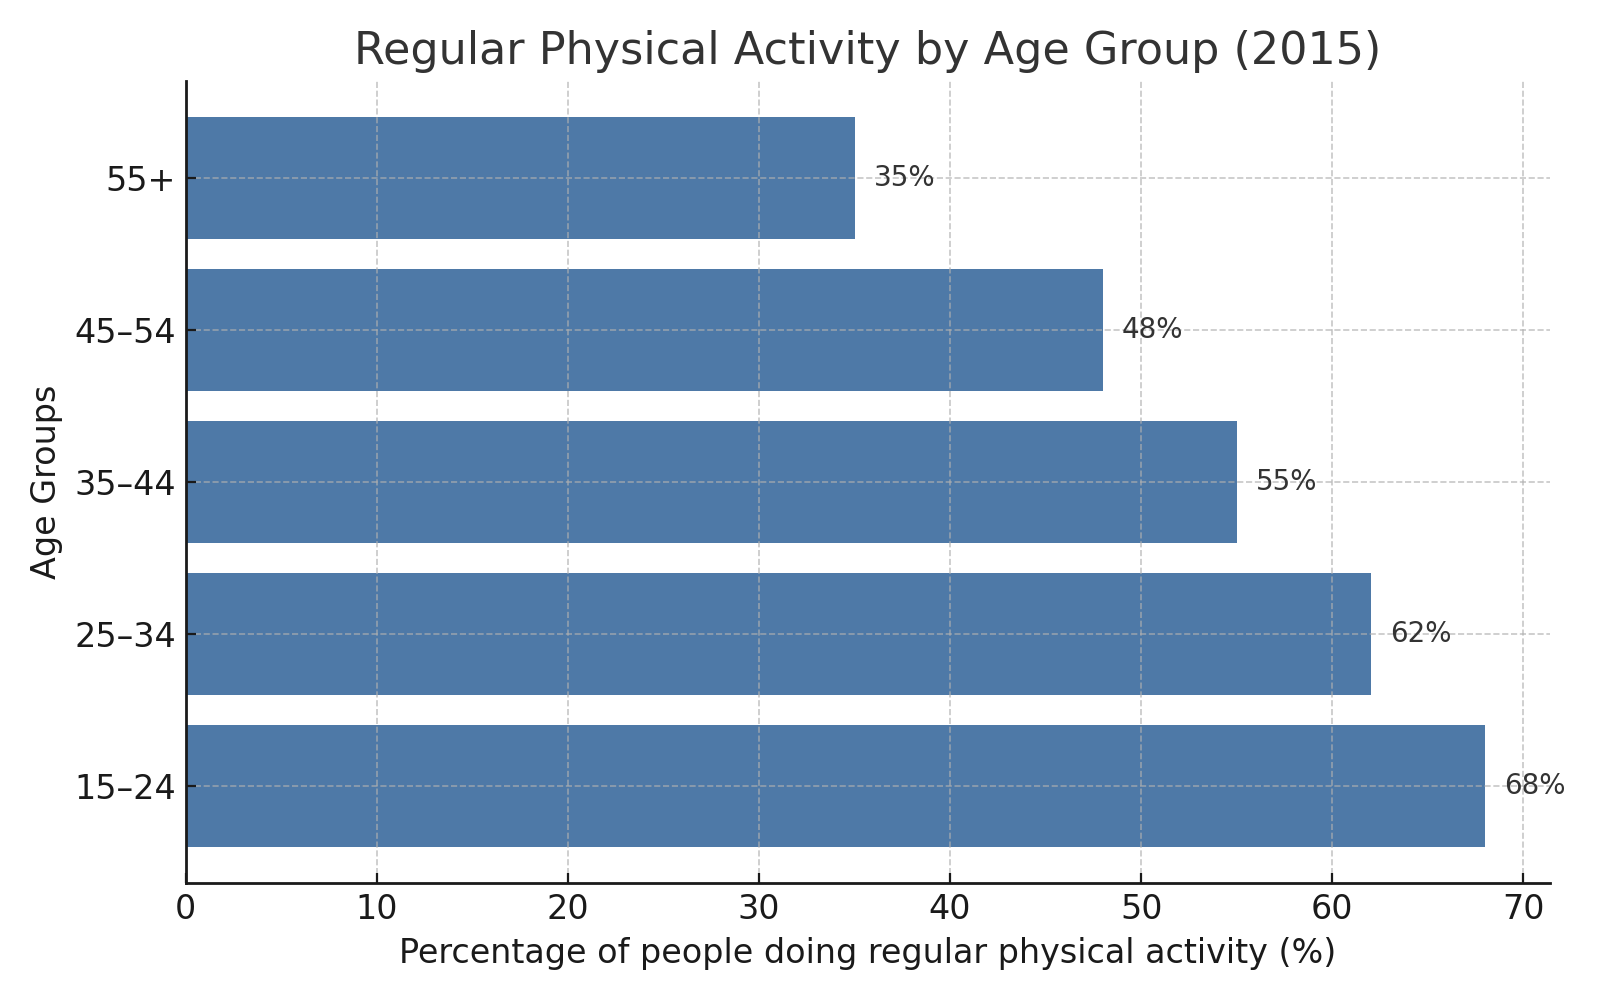
Figure: Regular physical activity by age group (2015)

Sample Answer (Band 7.5–8)

The horizontal bar chart illustrates the proportion of individuals in different age categories who took part in regular physical activity in 2015. Overall, the data highlight a clear downward trend as age increases, with the youngest participants being the most active and the elderly the least.

At the top of the scale, almost 68% of those aged 15–24 reported exercising regularly. The second youngest group, 25–34, showed a slightly lower figure at around 62%. A more noticeable decline is visible in the 35–44 bracket, where just over half (55%) maintained an active lifestyle. The proportion continued to drop among 45–54-year-olds, with fewer than half (48%) engaging in physical activity.

The most dramatic difference can be seen in the oldest category. Only about 35% of people aged 55 and over were physically active, which is nearly half the rate of the youngest group. This contrast underlines a strong inverse relationship between age and exercise participation. While younger individuals seem highly motivated to engage in sports or fitness, older adults appear less inclined to do so, possibly due to lifestyle changes or health limitations. In short, the chart suggests that maintaining high activity levels becomes increasingly challenging with age.

Detailed Analysis & Feedback – Test 05 (Bar Chart)

  • Strengths:
    • ✔️ The answer provides a clear and explicit overview in the introduction, which is a crucial requirement for Band 7 and above.
    • ✔️ Key features are logically grouped: younger groups vs. older groups, with emphasis on the steady downward trend.
    • ✔️ Numerical data is reported accurately and concisely without overloading the text with unnecessary repetition.
    • ✔️ Vocabulary is sufficiently varied and academic: terms such as "inverse relationship," "proportion," "engagement" demonstrate lexical resource.
    • ✔️ The answer includes a concise conclusion, summarizing the main trend effectively.
  • Weaknesses:
    • ❌ Sentence structures are correct but lack variety. Most are compound or simple complex sentences; very few advanced structures such as conditional or concessive clauses are used.
    • ❌ Cohesive devices are somewhat repetitive (while, as, whereas). More diversity would raise coherence and cohesion.
    • ❌ Limited analytical depth. The response mainly describes data but does not suggest reasons, implications, or significance of trends, which could demonstrate higher-level thinking.
    • ❌ Some opportunities for direct comparisons (e.g., “twice as many young adults as seniors”) are missed.
  • Stronger Vocabulary & Synonyms:
    • "declined steadily" → "dropped consistently," "diminished progressively," "waned gradually"
    • "the lowest rate" → "the smallest proportion," "the minimal share," "the least engagement"
    • "the most dramatic difference" → "the sharpest disparity," "the most striking contrast"
    • "maintained an active lifestyle" → "sustained regular exercise," "remained consistently active"
    • "inverse relationship" → "negative correlation," "contrasting trend"
  • Suggestions for Improvement:
    • 🔹 Expand sentence structures: Use conditional and concessive clauses. Example: “Had older adults participated at the same pace as younger groups, the overall figures would have been considerably higher.”
    • 🔹 Provide more explicit comparisons: e.g., “The proportion of active young adults was almost double that of the oldest group.”
    • 🔹 Add implications: Show higher-level thinking, such as “This decline suggests that lifestyle, work commitments, or health limitations increasingly restrict physical activity with age.”
    • 🔹 Vary linking devices: Instead of repeating “while” or “although,” use “in contrast, conversely, nevertheless, notwithstanding.”
    • 🔹 Enrich the conclusion: Move beyond summarizing to interpret: “The chart highlights not only a generational divide in activity levels but also potential challenges for public health policy.”
  • Band Justification:

    The response fully addresses the task by describing key trends and making comparisons, meeting the criteria for Task Achievement at Band 7.5–8. Coherence and cohesion are clear but limited by repetitive connectors. Lexical resource is strong, but could be expanded further with high-level academic terms. Grammar is accurate overall, but lacks complex variety. With greater syntactic flexibility, richer vocabulary, and deeper analysis of implications, this answer could comfortably achieve Band 8.5–9.

Analysis & Feedback – Test 05 (Bar Chart)

Strengths

  • ✔️ Clear overview provided at the beginning, meeting IELTS requirements.
  • ✔️ Logical structure with grouped key features and clear comparisons.
  • ✔️ Vocabulary is varied and academic: "inverse relationship," "proportion," "engagement."
  • ✔️ Accurate data description without redundancy.

نقاط قوت

  • ✔️ یک نمای کلی واضح در مقدمه ارائه شده است، که برای نمره ۷ به بالا ضروری است.
  • ✔️ ساختار پاسخ منطقی است و ویژگی‌های کلیدی به‌درستی گروه‌بندی شده‌اند.
  • ✔️ واژگان متنوع و علمی به‌کار رفته‌اند (مانند: "رابطه معکوس"، "درصد"، "مشارکت").
  • ✔️ داده‌ها به‌طور دقیق و بدون تکرار غیرضروری گزارش شده‌اند.

Weaknesses

  • ❌ Sentence structures lack variety, mostly compound or simple complex.
  • ❌ Cohesive devices are repetitive (while, although, whereas).
  • ❌ Limited analytical depth; lacks explanation of reasons or implications.
  • ❌ Missed opportunities for direct comparisons (e.g., “twice as many…”).

نقاط ضعف

  • ❌ تنوع ساختاری جملات کافی نیست و بیشتر جملات ترکیبی ساده‌اند.
  • ❌ ابزارهای انسجامی تکراری هستند (مانند while, although, whereas).
  • ❌ تحلیل عمیق وجود ندارد؛ دلیل یا پیامدها توضیح داده نشده‌اند.
  • ❌ فرصت مقایسه‌های مستقیم (مانند "دو برابر") استفاده نشده است.

Stronger Vocabulary

  • "declined steadily" → "dropped consistently," "diminished progressively"
  • "the lowest rate" → "the smallest proportion," "the minimal share"
  • "the most dramatic difference" → "the sharpest disparity," "the most striking contrast"

مترادف‌های قوی‌تر

  • "کاهش پیوسته" → "افت تدریجی"، "نزول مداوم"
  • "کمترین نرخ" → "کوچک‌ترین سهم"، "حداقل میزان"
  • "بیشترین تفاوت" → "بیشترین شکاف"، "واضح‌ترین تضاد"

Suggestions for Improvement

  • 🔹 Use advanced structures (conditionals, concessives).
  • 🔹 Add explicit comparisons: “Young adults were nearly twice as active as seniors.”
  • 🔹 Provide implications: “This decline may reflect lifestyle or health limitations.”
  • 🔹 Vary connectors: “nonetheless, conversely, notwithstanding.”

پیشنهادهای بهبود

  • 🔹 از ساختارهای پیشرفته مثل شرطی و امتیازی استفاده کنید.
  • 🔹 مقایسه‌های واضح‌تر اضافه کنید: "جوانان تقریبا دو برابر سالمندان فعال بودند."
  • 🔹 به پیامدها اشاره کنید: "این کاهش ممکن است به تغییر سبک زندگی یا محدودیت‌های سلامتی مربوط باشد."
  • 🔹 ابزارهای انسجامی متنوع‌تر به کار ببرید: nonetheless, conversely, notwithstanding.

Band Justification

The response meets task requirements with clear comparisons and accurate figures, achieving Band 7.5–8. To reach Band 8.5–9, more varied grammar, deeper analysis, and richer vocabulary are required.

توجیه نمره

پاسخ الزامات تسک را برآورده کرده و مقایسه‌ها و اعداد را دقیق ارائه داده است، بنابراین در محدوده ۷.۵ تا ۸ قرار می‌گیرد. برای رسیدن به ۸.۵ یا ۹، تنوع بیشتر در دستور زبان، تحلیل عمیق‌تر و واژگان غنی‌تر لازم است.